The Month We Were Reading Wrong
By the company dashboard, May was an average month. Counted properly, it was the best month of the year.
The short version: Our dashboard counted an enrolment in the month it closed. That is how almost every dashboard works. But our buyers take weeks to decide, so the month that earned an enrolment and the month that recorded it were rarely the same. May looked ordinary. May was our best month by a wide margin — and we nearly optimised away the thing that caused it.
What we believed
Count an enrolment when the money lands. Simple, clean, matches finance.
Every dashboard I have ever used does this. It is the default because it is easy, and because in a business with same-day purchases it is also correct.
What actually happened
Our product is a career program. People discover it, read for a while, talk to a counsellor, talk to their family, and decide. That takes weeks.
So I rebuilt the numbers a second way: credit each enrolment to the month the person first became a lead, not the month they paid. Then compare.
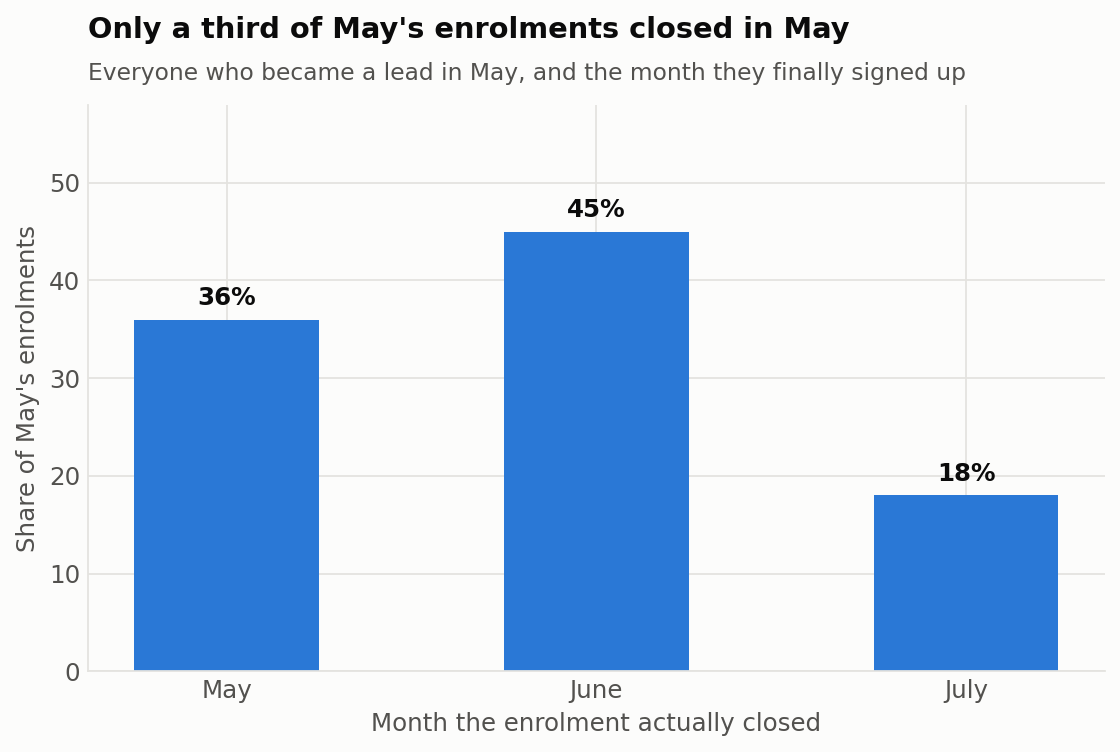
Just over a third of the people who arrived in May signed up in May. Nearly half signed up in June. The rest came through in July.
Read by close month, May looks unremarkable. Read properly, May produced more enrolments than any other month of the year.
What that does to the conversion rate
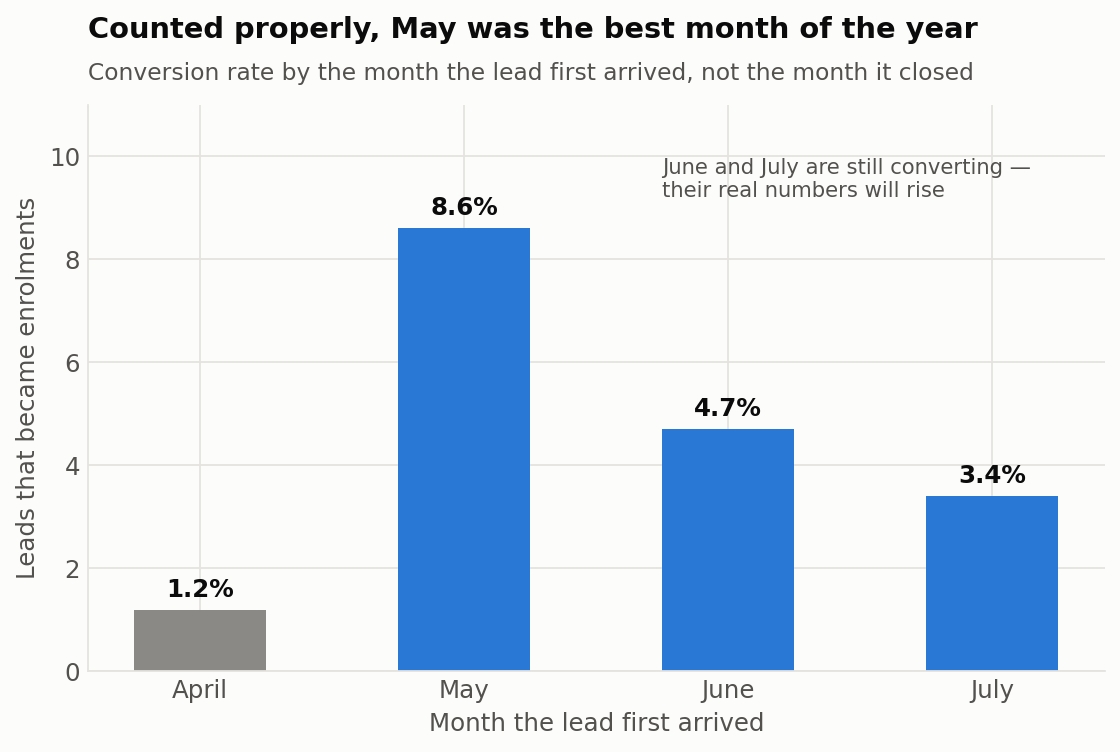
May converted at 8.6% against April's 1.2% — seven times better.
June and July look weaker on this chart, but they are not finished. Those groups were still converting when the chart was made. Their real numbers will rise. That is the second thing cohort reporting forces you to be honest about: recent months always look worse than they are, and you have to say so out loud.
Why this mattered more than it sounds
May was also the month our organic search visibility recovered sharply and our AI-assistant traffic tripled. Under calendar-month counting, none of that appeared to produce anything — the enrolments showed up in June and July, long after anyone was still looking at May.
We were about a month away from concluding that the May work "didn't convert" and moving budget somewhere else.
Cohort reporting is the only reason we could connect cause to effect at all. Every other piece of analysis I did that year — which channel is worth funding, which page change worked, whether AI traffic is real demand — depends on it.
What changed
The default view became cohort-based. Leads and enrolments are credited to the month the lead arrived.
Close-month remains as a second view, clearly labelled, because finance needs it and because it answers a different question: not "did it work?" but "what landed this month?"
Immature months are marked immature. Any month still converting carries a visible note. A number that will rise gets said so, in the table, not in a footnote nobody reads.
The principle
When conversion lags acquisition, calendar-month reporting will systematically credit the wrong month. Use cohorts, or you are guessing about cause.
The longer your sales cycle, the worse the distortion:
| Buying cycle | Distortion from calendar-month counting |
|---|---|
| Same day (retail, food) | None. Calendar is fine. |
| 1–2 weeks (small software) | Mild. Worth checking quarterly. |
| 1–3 months (education, B2B) | Severe. Cause and effect land in different months. |
| 6+ months (enterprise, property) | Total. Calendar reporting tells you almost nothing about what works. |
The test: take your best month this year and ask when those buyers actually arrived. If a real share of them arrived in a different month, your dashboard is crediting the wrong work — and you are probably about to defund something that is working.
What I'd flag
This required manually reconciling three overlapping records of the same enrolments, which disagreed with each other. Two entries still carry an open question about which month they closed in. That does not move the conclusion — the pattern holds whichever way those two resolve — but the reconciliation was the real work here, not the analysis.
The cleaner fix is upstream: record the first-touch date properly at the point of capture, so nobody has to rebuild this by hand later.
# Data: CRM lead and enrolment exports, April – August 2026, reconciled across three source records. Absolute counts withheld; percentages and ratios shown throughout.
cd ~/blog