The Metric That Hid a Collapse
For a full month, our main number looked fine. Underneath it, the site was falling apart.
The short version: Through April 2026, Kraftshala's organic clicks stayed flat. The weekly report looked healthy. Underneath, our search visibility fell by two-thirds and our average Google position dropped from 7th to 17th. Nobody caught it, because the number we reported was the last one to move.
What we believed
Clicks are the business number. People land on the site, fill a form, become a lead. So the weekly SEO report led with clicks.
That is a reasonable belief. It is also how most SEO reports are built.
What actually happened
Here is April and May, day by day.
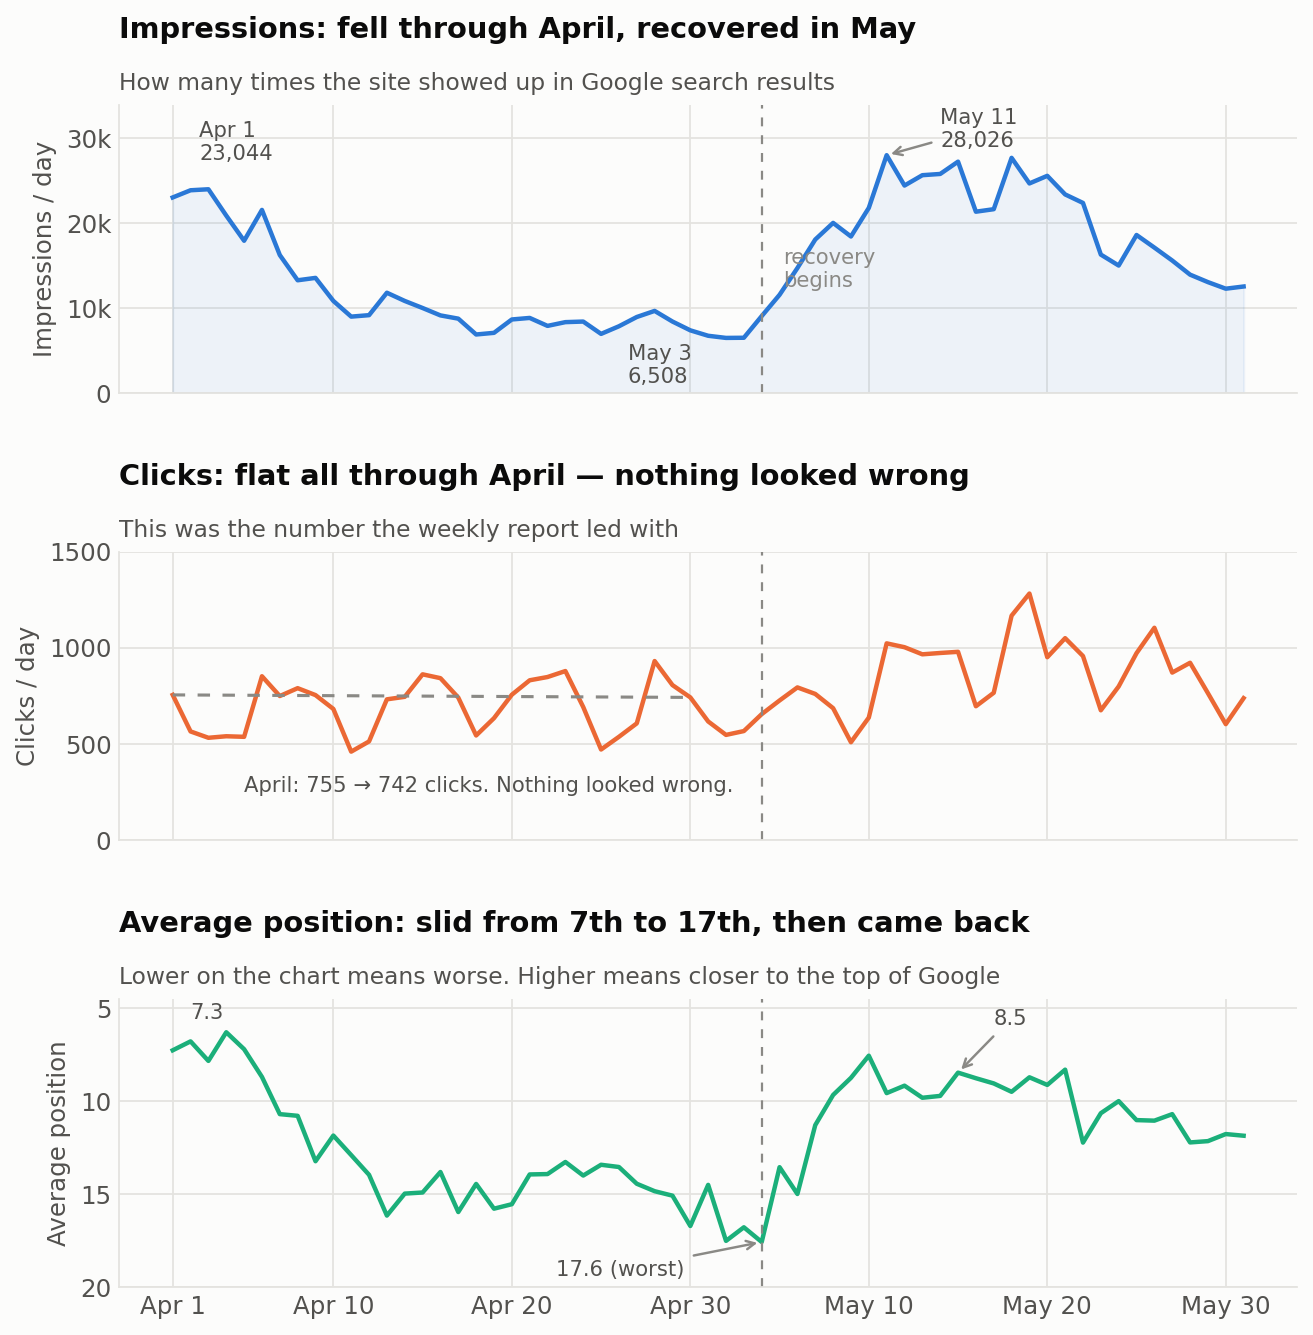
Read the three panels together. That is the whole story.
Impressions — how often we appeared in search results at all — fell from 23,044 a day on 1 April to 7,382 by 30 April. A 68% drop in one month.
Clicks went from 755 to 742. Flat. No dip, no spike, nothing to raise a hand about.
Average position slid from 7.3 to 16.7. We went from the bottom of page one to the middle of page two.
Why clicks didn't move
When you lose long-tail visibility, you lose the searches that almost never get clicked. The head terms — the ones that actually bring people — hold on longest.
So the traffic stays. The reach goes.
There was a second trap in the data. Because impressions fell and clicks didn't, our click-through rate went from 3.3% to 10.1%.
On a dashboard, that reads as a win. CTR tripled. In reality it was the arithmetic of a shrinking denominator.
| April | Impressions/day | Clicks/day | CTR | What the report said |
|---|---|---|---|---|
| Week 1 | ~21,000 | ~640 | 3.1% | steady |
| Week 2 | ~11,000 | ~690 | 6.3% | CTR improving |
| Week 3 | ~8,300 | ~740 | 8.9% | CTR improving again |
| Week 4 | ~8,100 | ~730 | 9.0% | best CTR of the year |
Four weeks of "improvement" while the floor gave way.
What it cost
Nothing, immediately. That is the point.
The damage only showed up later, indirectly. Impressions are the pool that clicks are drawn from. Shrink the pool for long enough and the clicks follow. We were one more month from finding out the hard way.
What changed
Two things.
The weekly report now leads with impressions and average position, with clicks third. Impressions move first. Position moves second. Clicks move last. If you only report the last one, you only find out last.
CTR is never reported on its own. It is always shown next to the impressions it was calculated from. A rising CTR on falling impressions is a warning, not a win — and the two numbers side by side make that obvious without anyone having to explain it.
The principle
A flat headline number can hide a collapse in the thing that feeds it. Report the leading indicator, not the lagging one.
This is not only an SEO problem. Any funnel has the same shape:
| Field | Lagging number people report | Leading number that moves first |
|---|---|---|
| SEO | Clicks | Impressions, average position |
| Paid ads | Conversions | Impression share, auction overlap |
| Signups | Deliverability, inbox placement | |
| Sales | Closed deals | Meetings booked, pipeline created |
| Product | Revenue | Activation rate, week-2 retention |
The test to apply to your own reporting is one question: if this broke today, how long until my main number showed it?
If the answer is more than a couple of weeks, you are not monitoring. You are waiting.
What I'd flag
The April fall itself has no confirmed single cause in our records — we have the effect clearly, not the trigger. That does not change the lesson, which is about detection rather than diagnosis. But I would rather say so than imply a tidy story.
There is also a measurement caveat: a Google Search Console change in February makes comparisons across that boundary unreliable. April-to-May sits entirely inside the stable period, so the figures above are sound.
# Data: Google Search Console, daily, sitewide, 1 April – 31 May 2026.
cd ~/blog